
PSI GLOBAL LOGISTICS
8718 WESTPARK DR, HOUSTON, TX 77063
713-589-2925
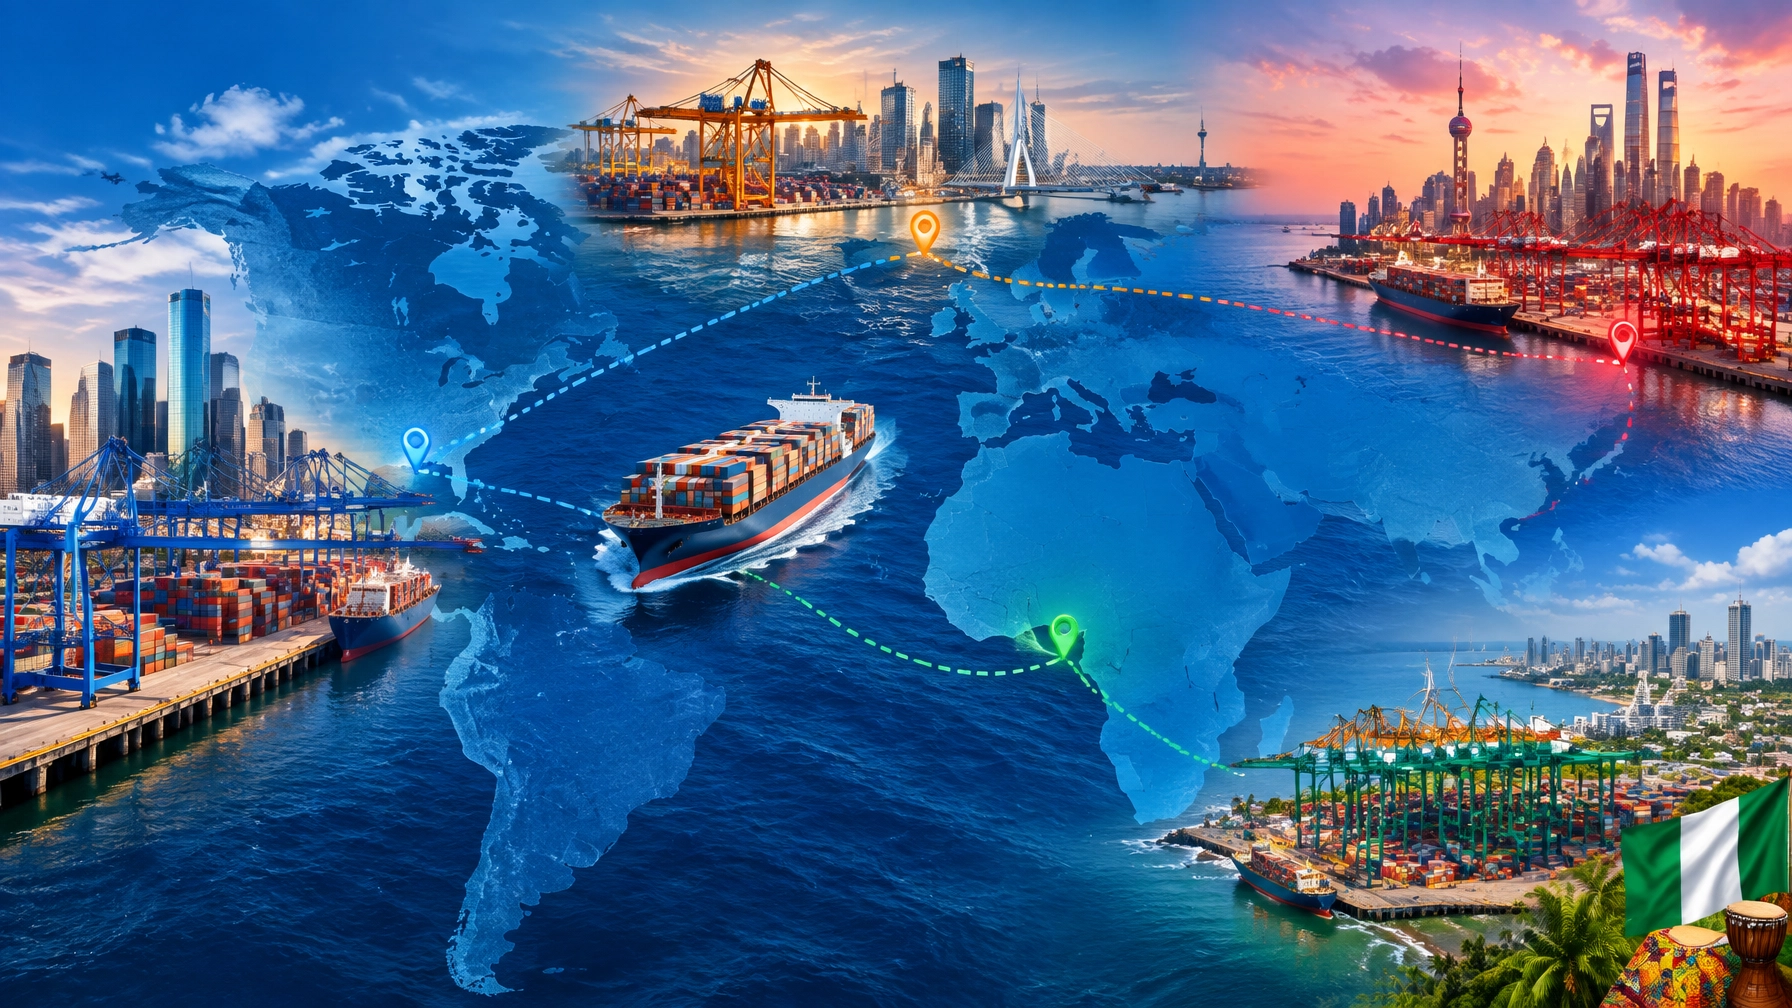
Port rankings show where the world’s container traffic concentrates. For your cargo, though, the right port depends on its origin and destination, the carrier’s route, transshipment plans and current operating conditions, not simply which port handles the most freight.
The latest available ranking as of October 2026 covers the first half of 2026. Shanghai remains No. 1, while Ningbo-Zhoushan moves ahead of Singapore into second place. The ranking below follows reported first-half throughput; Port Klang’s figure is an estimate.
How is the 2026 ranking of major seaports measured?
The ranking uses container throughput reported for January–June 2026, in TEUs. It is a midyear snapshot, not a full-year result. The Los Angeles–Long Beach entry combines two ports, while Port Klang’s reported position and estimated throughput should be read with that qualification. Alphaliner’s figures, reported by Container News, provide the basis for this list.
What does Shanghai’s No. 1 position mean for cargo?
Shanghai handled 28.737 million TEUs, up 6.2% year over year, retaining its position as the world’s busiest container port. Its scale connects shippers to extensive carrier networks and Asian manufacturing regions. High volumes do not guarantee faster transit, however: check the specific sailing, connecting services and planned departure before setting delivery expectations.
Why does Ningbo-Zhoushan rank No. 2 in 2026?
Ningbo-Zhoushan moved into second place with 22.9 million TEUs, up 8.8%. Enough to edge past Singapore’s 22.742 million in the first half of 2026. Its growth reflects strong export flows from eastern China. For shippers, it is a major gateway to consider when comparing carrier services from the region, not an automatic shortcut to a shorter journey.
What does Singapore’s No. 3 ranking mean for international cargo?
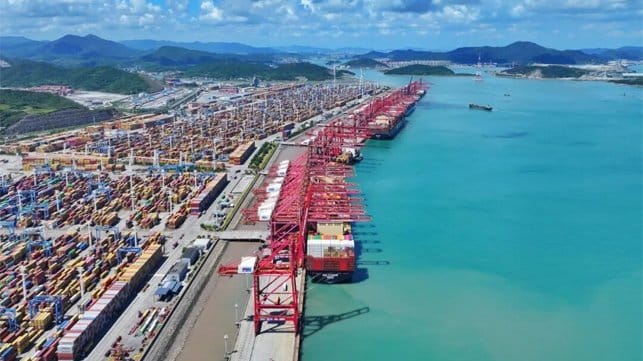
Singapore handled 22.742 million TEUs, up 4.7%, and remains a key transshipment hub connecting services across Asia and global trade lanes. A shipment routed through Singapore may involve a vessel transfer rather than a direct sailing. Confirm the complete port sequence and connection window when planning cargo deadlines.
How does Shenzhen’s position affect shipments from southern China?
Shenzhen ranked fourth with 18.56 million TEUs, up 7.7%. Its port complex serves major manufacturing and export centers in southern China, making it relevant for businesses sourcing from that region. The cargo’s factory location, pickup plan and carrier schedule all matter: a nearby gateway can help simplify the inland leg, but not necessarily the ocean transit.
What should shippers know about Qingdao?
Qingdao handled 17.56 million TEUs, up 7.2%, placing it fifth. It is a significant northern China gateway for regional exports and connections. For cargo originating in northern China, compare the inland movement and sailing options from Qingdao against alternative gateways. A port’s throughput rank alone does not reveal which departure offers the best end-to-end lead time.
When is Guangzhou relevant to your cargo plan?
Guangzhou ranked sixth, handling 14.03 million TEUs, up 2.9%. Its location gives shippers a gateway option in southern China. If your supplier is in the Pearl River Delta, ask whether routing through Guangzhou or another nearby port fits the carrier’s current schedule and reduces handoffs between the factory, terminal and vessel.
What does Tianjin’s growth mean for northern China shipments?
Tianjin rose to seventh with 13 million TEUs, a 6.1% year-over-year increase. It is an important gateway for northern China cargo. For shipments from inland suppliers, allow time for domestic transport to the port and check cut-off dates carefully. A missed terminal deadline can mean waiting for a later sailing, regardless of port capacity.
How does Busan support international shipping routes?
Busan handled 12.601 million TEUs, down 0.7%, and ranked eighth. It remains an important hub in South Korea and a connection point on international services. If your cargo uses a transfer in Busan, check the connection time and the onward vessel schedule; transshipment can expand routing choices, but each handoff adds a milestone to monitor.
What does the Los Angeles–Long Beach ranking mean for U.S. cargo?
The combined Los Angeles–Long Beach gateway ranked ninth, with 9.975 million TEUs, up 2.8%. It is a major U.S. port complex, but not necessarily the best choice for cargo originating in Houston. Compare the full inland distance, departure options and destination routing before selecting a U.S. gateway.
Why did Port Klang enter the top 10?
Port Klang ranked tenth with approximately 7.7 million TEUs, an estimate in the first-half ranking. Its position reflects a shifting global port landscape, not a guarantee of a particular service or transit time. For cargo moving through Malaysia, verify the available carrier connection and whether the route is direct or involves another port.
How do port delays affect cargo lead times in 2026?
Global schedule reliability is a planning risk, not just a port statistic. A September 2026 report put reliability at about 27%, with average vessel delays near six days. A snapshot for that month, not a full-year average. Build schedule buffers around delivery-critical cargo and confirm updated vessel milestones with your logistics provider. (Port Technology International)
Ports and shipping partners are also adopting AI, digital twins and green shipping corridors. These tools can help model operations, improve arrival planning, exchange port-call data and support lower-emission voyages. Singapore and Rotterdam, for example, report testing port-to-port data exchange and pursuing cleaner shipping along their corridor. (Maritime and Port Authority of Singapore)
For shippers, the practical takeaway is simple: technology can improve visibility and coordination, but it cannot remove every disruption. Use current sailing information, track the cargo’s progress and plan for potential schedule changes.
What do these rankings mean for Houston-to-Nigeria shipments?
These top 10 are global container gateways, not a direct ranking of the fastest routes from Houston to Nigeria. Nigerian cargo typically needs a route planned around its destination, carrier service and local port handling. Your end-to-end lead time also depends on pickup, documentation, vessel schedules, customs clearance and final delivery.
For Houston-origin freight, focus on a coordinated journey, not a port name in isolation. PSI Global Logistics supports door-to-door shipping from Houston to Nigeria and heavy machinery shipping. Our team manages efficient logistics workflows, streamlined documentation and reliable door-to-door pickup services, including complimentary Houston air cargo pickup. Live tracking and responsive customer support help you stay informed from collection through delivery.
What are common questions about major seaports of the world?
Port rankings help compare cargo gateways, but they do not predict the lead time for an individual shipment. Route, carrier schedule, transfers, port conditions and inland delivery all affect the final timeline. Use the questions below as a quick guide when planning freight.
Is Shanghai still the world’s busiest container port in 2026?
Yes. Shanghai handled 28.737 million TEUs in the first half of 2026 and remained the top-ranked port in the latest available comparable ranking.
Did Ningbo-Zhoushan overtake Singapore?
Yes. In the first-half 2026 ranking, Ningbo-Zhoushan handled 22.9 million TEUs, narrowly ahead of Singapore’s 22.742 million.
Does a higher-ranked port mean my shipment arrives sooner?
No. Rankings measure throughput, not the transit time for a particular shipment. Check the actual carrier schedule, route, transfers and inland delivery plan.
Are the 27% schedule-reliability and six-day delay figures annual averages?
No. They refer to a reported September 2026 snapshot. Treat them as an indicator of schedule risk for that period, not a guaranteed delay for every shipment.
Sources
- Container News: Shanghai leads global container port rankings in first half of 2026
- Port Technology International: Global shipping reliability sinks to 27 per cent
- Maritime and Port Authority of Singapore: Rotterdam and Singapore strengthen green and digital shipping corridor
- The Maritime Executive: Ningbo-Zhoushan tops Singapore as the world’s second-busiest container port






Leave A Comment